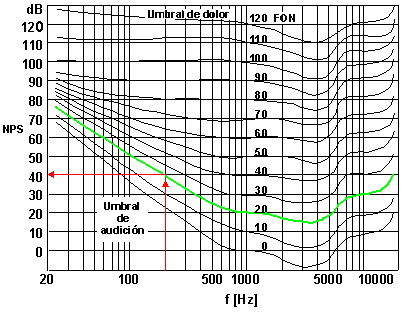
Fletcher and Munson Contours
SOUND LEVELS
Sound Pressure
First we have the atmospheric pressure, i.e., the environmental air pressure in absence of sound. It is measured in a SI (Système International, i.e., International System) unit called Pascal (1 Pascal is equal to a force of 1 Newton acting on a surface of 1 square meter and is abbreviated 1 Pa). This pressure amounts to roughly 100,000 Pa (the standard value is 101,325 Pa). Then we can define sound pressure as the difference between the actual instantaneous pressure due to sound and the atmospheric pressure, and, of course, it is also measured in Pa. However, sound pressure has usually a value much smaller than the one corresponding to the atmospheric pressure. For instance, unbearably loud sounds may be around 20 Pa, and just audible ones may be around 20 m Pa (m Pa stands for micropascal, i.e., a unit one million times smaller than the pascal). This is much the same as the case of some gentle ripples on the surface a swimming pool. It is not the magnitude the only difference between atmospheric pressure and sound pressure. Another important difference is that the atmospheric pressure changes very slowly, whereas sound pressure is rapidly changing, alternating between positive and negative values, at a rate of between 20 and 20,000 times per second. This rate is called frequency and is expressed in Hertz (abbreviated Hz), a unit equivalent to a cycle per second. In order to reduce the amount of digits, frequencies above 1,000 Hz are usually expressed in kilohertz, abbreviated kHz. 1 kHz equals 1,000 Hz
Sound Pressure Level
The fact that the ratio of the sound pressure of the loudest sound (before the sensation of sound is changed into pain) to the sound pressure of the lowest one is about 1,000,000 has led to the adoption of a compressed scale called a logarithmic scale. If we call Pref the sound pressure of a just audible sound and P the sound presure, then we can define the sound pressure level (SPL) Lp as
Lp = 20 log (P / Pref)
where log stands for the logarithm to the base 10 (ordinary logarithm). The unit used to express the sound pressure level is the decibel, abbreviated dB. The sound pressure level of audible sounds ranges from 0 dB through 120 dB. Sounds in excess of 120 dB may cause immediate irreversible hearing impairment, besides being quite painful for most individuals.
A-Weighted Sound Level
The sound pressure level has the advantage of being an objective yet a handy measure of sound intensity, but it has the drawback that it is far from being an accurate measure of what is actually perceived. This is because the ear's sensitivity is strongly dependent on frequency. Indeed, whearas a sound of 1 kHz and 0 dB is already audible, you need to raise up to 37 dB to be able to hear a tone of 100 Hz. The same holds for sounds above 16 kHz.
When this dependence of the sensation of loudness with frequency was discovered and measured (by Fletcher and Munson, in 1933), it was thought that by using an adequate filtering (i.e., frequency weighting) network, it would be possible to objectively measure that sensation. This filtering network would work in a similar way as the ear does, i.e., it would attenuate low frequency and very high frequencies, leaving middle frequencies almost unchanged. In other words, it would perform a bass and a treble cut prior to actually measuring the sound.

Fletcher and Munson Contours
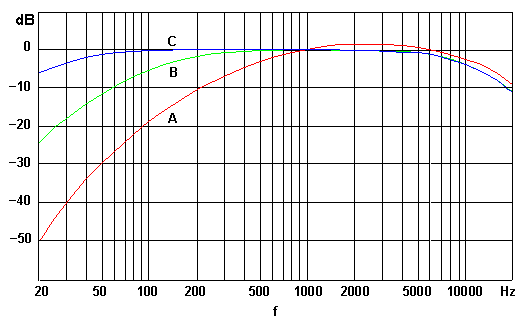
There were some difficulties, however, in achieving such a measuring instrument or system. The most obvious one was that the ear behaved in a different way as regards to frequency dependence for different physical levels of sound. For instance, at very low levels, only middle-pitched sounds are heard, whereas at high levels all frequencies are heard more or less with the same loudness. Thus, it seemed reasonable to design three weighting networks intended for use at 40 dB, 70 dB and 100 dB, called A, B and C. A-weighting would thus be used at low levels, B-weighting at medium levels, and C-weighting at high levels. The result of a measurement obtained with the A-weighting network is expressed in A-weighted decibels, abbreviated dBA or sometimes db(A).

A-, B- and C-frequency weighting contours
Of course, a sort of recursiveness was needed to complete a measurement. First one had to get an approximate value in order to decide whether to use the A, B or C network, and then perform the actual measurement with the appropriate weighting.
The second important difficulty comes from the fact that the Fletcher and Munson contours (as well as those finally standardized by ISO, i.e., the International Organisation of Standardization) are only statistical averages, with a fairly high standard deviation (a statistical measure of spread), so every measured value is appliccable to a population rather than to a specific individual; moreover, it is appliccable to an otologically normal population, because the contours where obtained within screened populations of otologically normal people.
The third difficulty has to do with the fact that those curves were obtained using pure tones, that is, single frequency sounds, which are actually very rare. Most everyday sounds, such as environmental noise, music or speech contain many frequencies at the same time. This has been perhaps the main reason why the originally intended application of the A-, B- and C-weightings failed.
Later studies showed that the loudness level, that is, a figure expressed in a unit called "phon" which equals the sound pressure level (in unweighted decibels) of an equally loud 1 kHz pure tone, did not constitute an actual scale for loudness. For instance, an 80-phon sound is not twice as loud as a 40-phon one. A new unit was devised, the "son", which may be measured using a spectrum analyzer (a measurement instrument capable of separating and measuring the different frequencies which compose sound or noise) and some calculations. As this scale, known plainly as loudness, is better correlated with the sensation of loudness, the ISO has standadrized the procedure (actually, two accepted procedures, according to the available data) under the ISO 532 International Standard. Nowadays there are even commercially available devices which automatically measure all the needed information and make the required computations to provide the loudness figure expressed in son.
A-Weighting and the Effects of Noise
To be sure, this does not answer the question of how annoying or disturbing a given noise may be. It is simply a scale for loudness. Several studies have focused on this issue, and there are some scales, such as the "noy" scale which quantifies noisiness under given assumptions, and of course, as afunction of the frequency content of the noise being assessed.
We can see, thus, that no available scale succeeds at measuring noise from an annoyance point of view, simply because annoyance is a very personal and context-related reaction.
Why has the A-weighting scale survived and become so popular and widespread?
Good question. The main reason is that several studies have shown a good correlation between A-weighted sound level and hearing damage, as well as speech interference. Without any other information available, the A-weighted sound level is the best single-figure guess available for assessing noise problems and making decisions. It also exhibits a fairly good correlation with the tendency of people to complain for noise pollution.
Interestingly, in spite of having been originally devised to measure low level sounds, the dBA scale proved to be better suited to measure hearing damage, which is likely to result from the exposure to loud sounds. How this has been discovered, I donīt know; perhaps it is traceably to the lack of other measuring instruments, or to accidental luck, or to the use of all kinds of instruments available while striving to push the frontiers of knowledge further.
As to its use in legal matters, for instance its use in most Noise Ordinances or Acts, it is because it gives an objective measure of sound. It does not depend on the judgement of an officer or a sufferer or an offender. Everybody can measure it and then say whether it exceeds or not a given acceptable level. Thatīs valuable, even if not perfect. More perfect measures will perhaps arise in the future, suitable for different situations.
Apendix
AUTHOR'S NOTE: The table below belongs to the Noise Pollution Clearinghouse, and its use here is courtesy of that organization.
The decibel (dB) table below compares some common sounds and shows how they rank in potential harm to hearing. 70 dB is the point at which noise begins to harm hearing. To the ear, each 10 dB increase seems twice as loud.
|
Sound Levels and Human Response |
||
|
Common sounds |
Noise Level [dB] |
Effect |
|
Rocket launching pad |
180 |
Irreversible hearing loss |
|
Carrier deck jet operation |
140 |
Painfully loud |
|
Thunderclap |
130 |
|
|
Jet takeoff (200 ft) |
120 |
Maximum vocal effort |
|
Pile driver |
110 |
Extremely loud |
|
Garbage truck |
100 |
Very loud |
|
Heavy truck (50 ft) |
90 |
Very annoying |
|
Alarm clock (2 ft) |
80 |
Annoying |
|
Noisy restaurant |
70 |
Telephone use difficult |
|
Air conditioning unit |
60 |
Intrusive |
|
Light auto traffic (100 ft) |
50 |
Quiet |
|
Living room |
40 |
|
|
Library |
30 |
Very quiet |
|
Broadcasting studio |
20 |
|
|
|
10 |
Just audible |
|
|
0 |
Hearing begins |